
Laying the Foundations: Building a Data Storybank
Throughout Fall 2017 and Spring 2018, the Data Refuge Storytelling team developed, tested, and tinkered with a number of paper and digital tools for telling stories about federal climate and environmental data and the human and nonhuman lives that it impacts. We've piloted these tools at a variety of venues that have engaged diverse publics mostly in Philadelphia and a few other cities too. University students and researchers, school children and their parents, climate and environmental data producers and consumers, archivists and librarians, and visual artists, playwrights, and poets, have shared their data stories with Data Refuge for the past six months. Here are some details about the storytelling tools, places, and people of Phase One that have moved us to tears and urgency, as well as hope and laughter. I'll share some more information on the tools that we're currently developing as we begin to scale the project nationally in Phase Two.
Data "MadLibs"

Inspired by one of our favorite games, the Data "MadLibs" is a fill-in-the blank form that prompts a series of questions about data, its producers, and its consumers, including age, relationship status, location. This tool is quick and accessible, offering researchers an opportunity to engage with their data on a more personal level.
The public engagement events at which this tool was mobilized include The Annual Meeting of the American Geophysical Union (New Orleans), the Penn Program in Environmental Humanities Lower Schuylkill Corps Meeting (Philadelphia), and the University of Pennsylvania TeachIn (Philadelphia), AAAS Conference (Austin), NICAR Conference (Chicago). At each of these events, we asked participants to pin where their data and data stories live; what we've learned so far, is that data lives and moves in multiple places throughout the world.


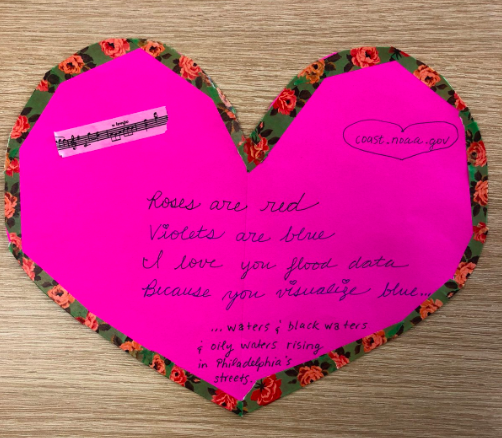
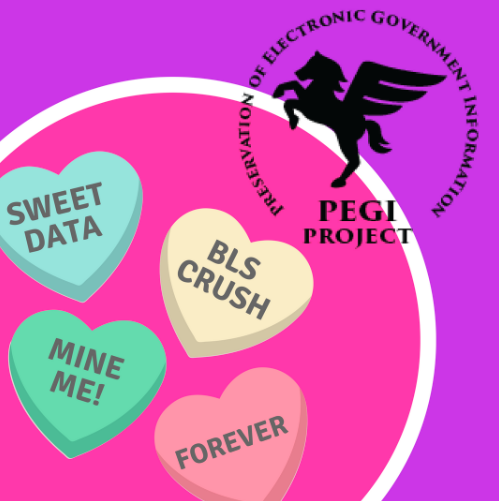
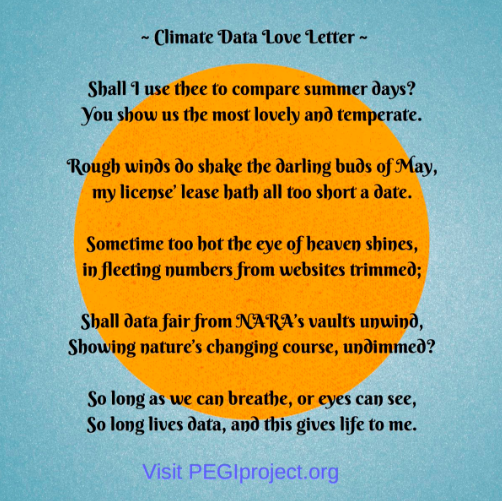
Data Valentines
For Love Data and Endangered Data Weeks in February, we placed a virtual call for Data Valentines or love letters in which data users, producers, archivists, and beneficiaries expressed their love for environmental and climate data. Using the hashtags #LoveData #DataValentines #DataStories, our friends and collaborators expressed how they felt about data through poetry, glitter, and paper hearts.


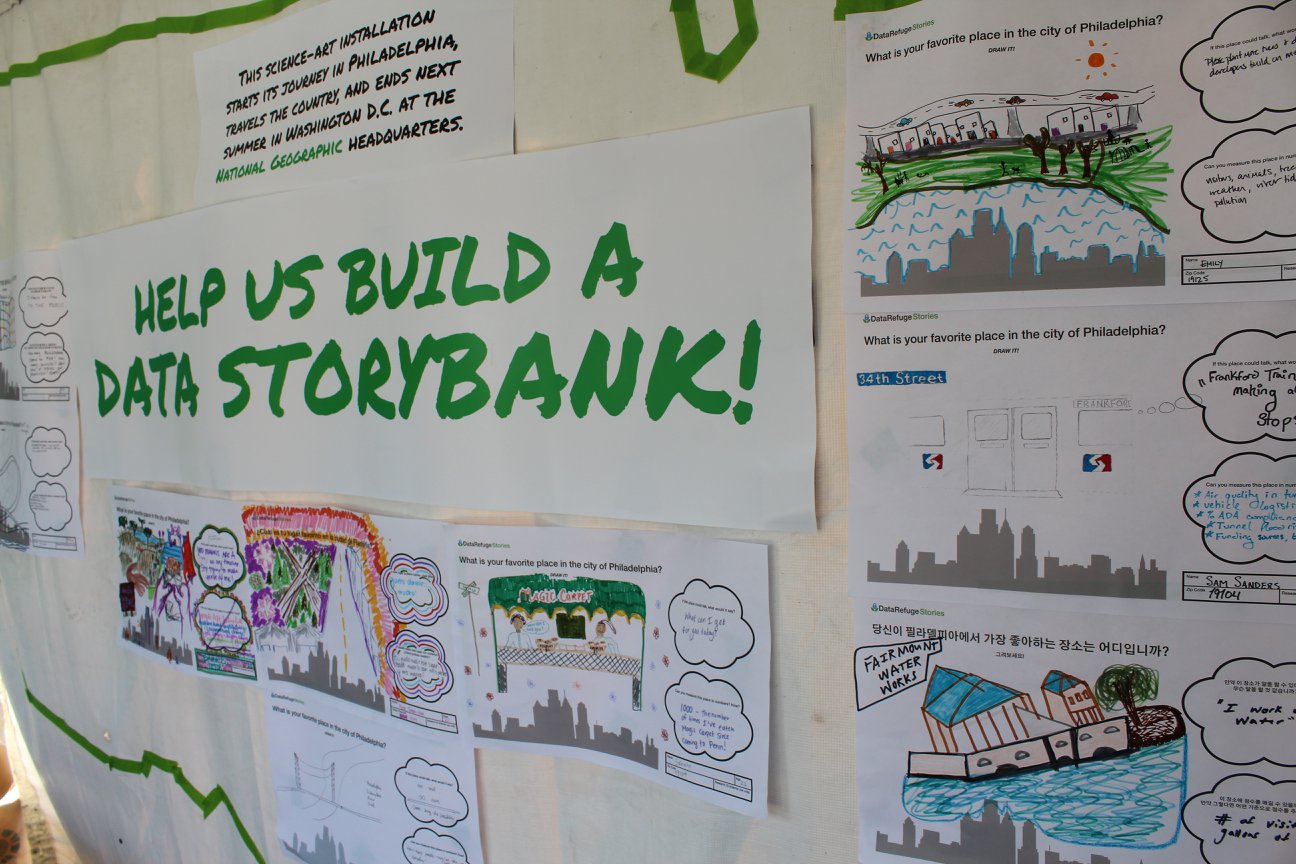
Dream Data
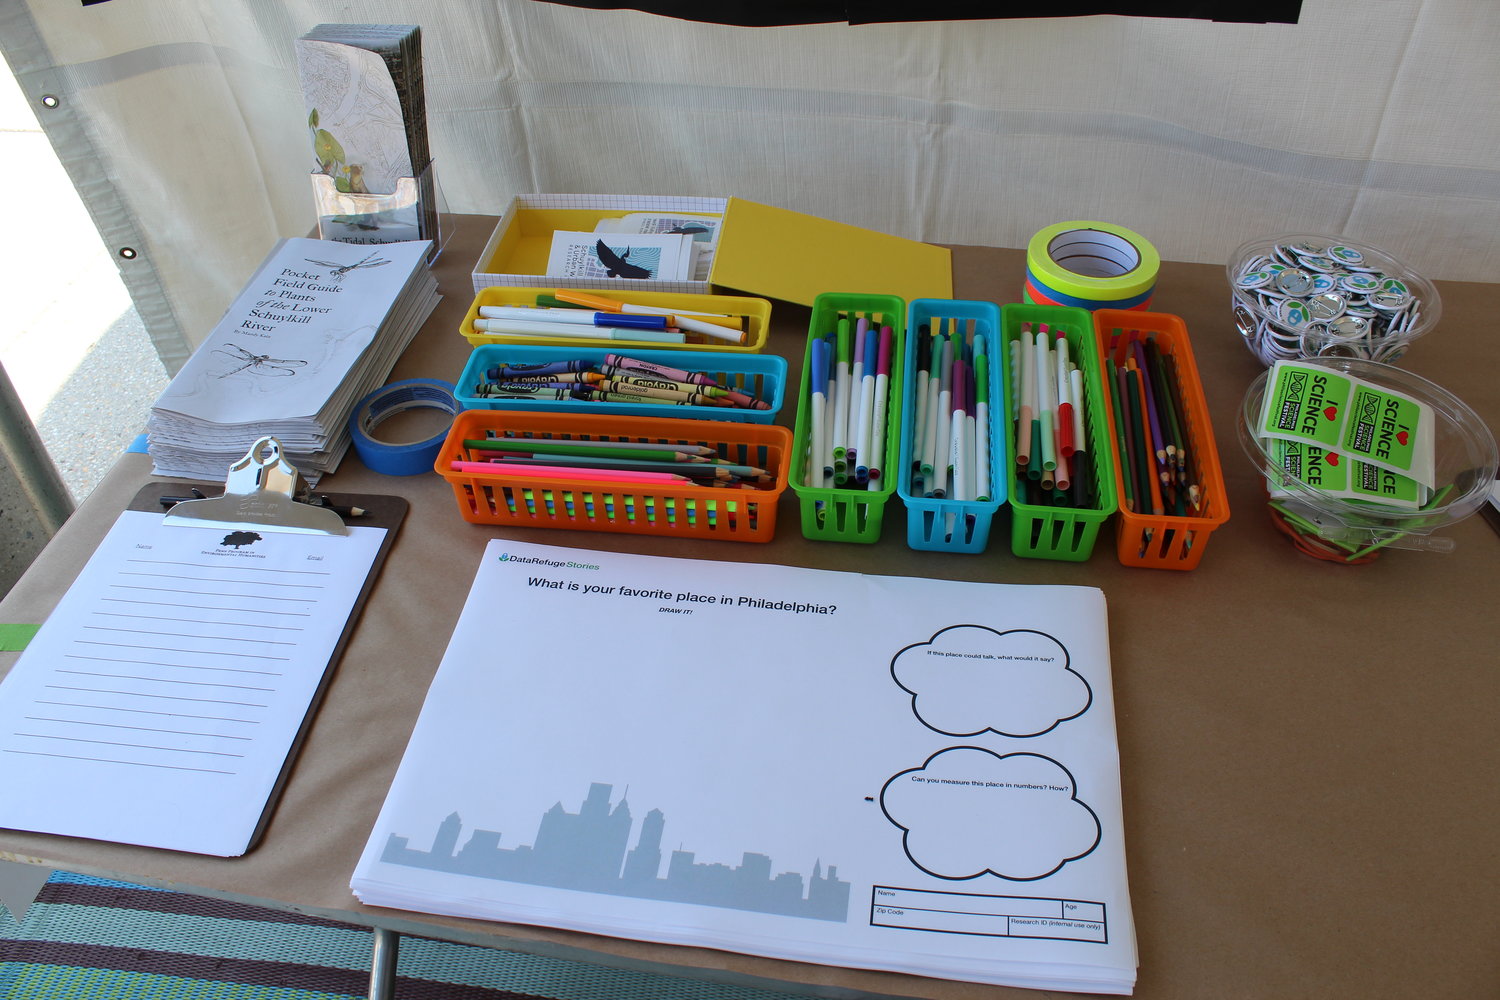
While the first tools that we developed asked participants to describe their relationship to environmental and climate data, our latest tools ask storytellers to share their Dream Data, or the data that they wish they had. With school children in mind, the first of these tools addresses these questions by asking about them to draw their favorite place in the city of Philadelphia, followed by questions asking how they imagine what these places would say and how one might measure these places with numbers. We piloted this tool at the Philadelphia Science Fair in April 2018.

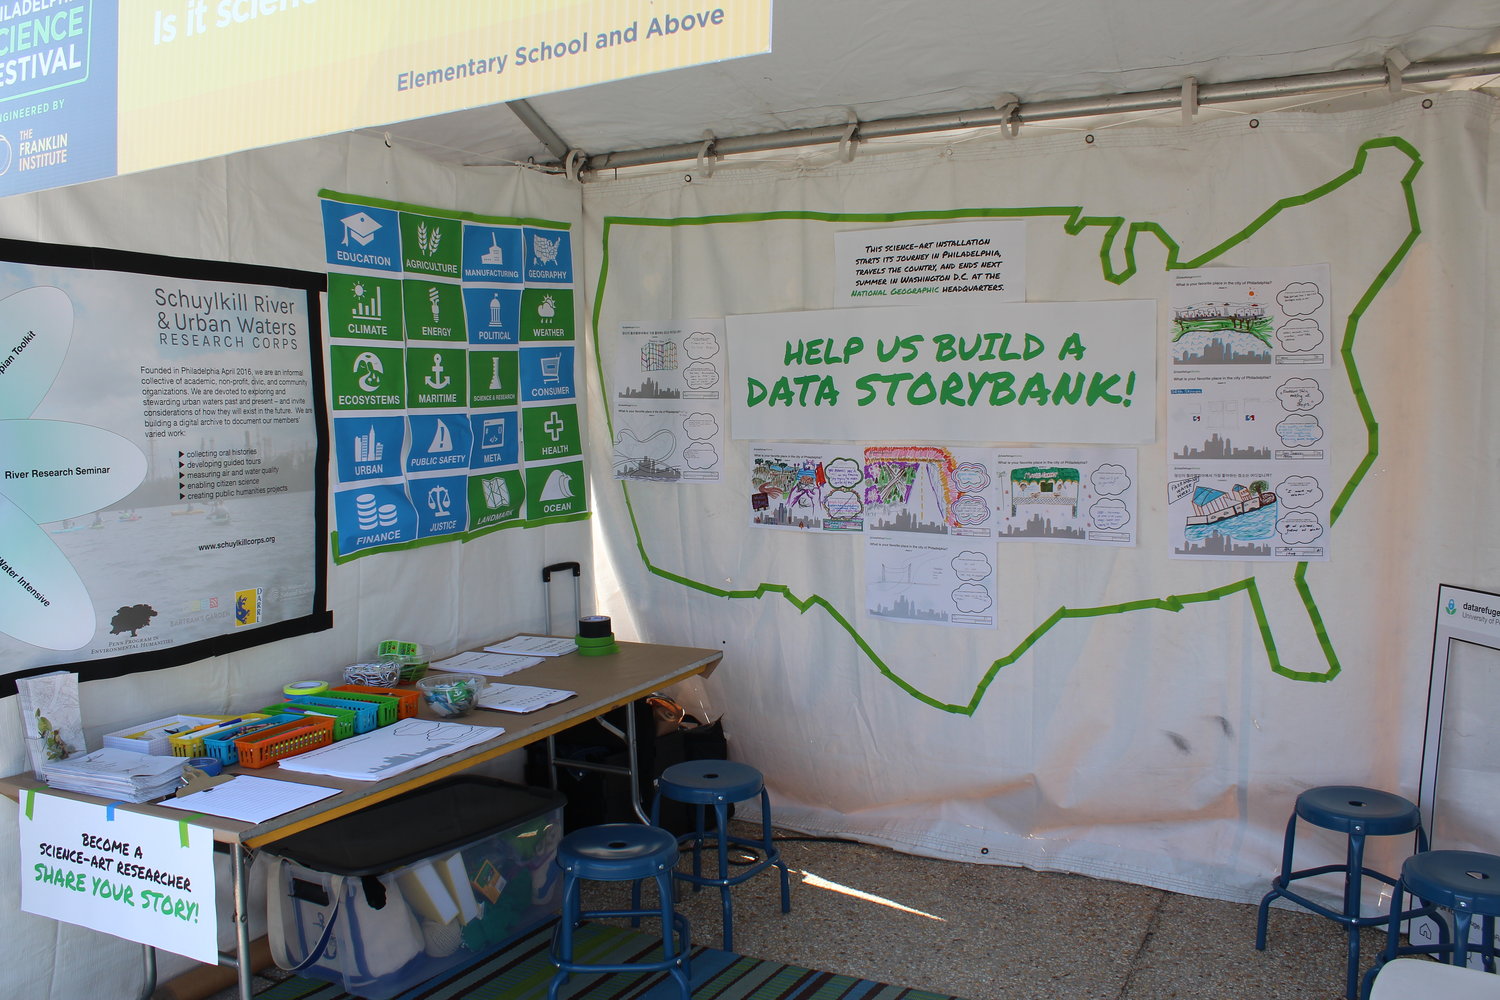
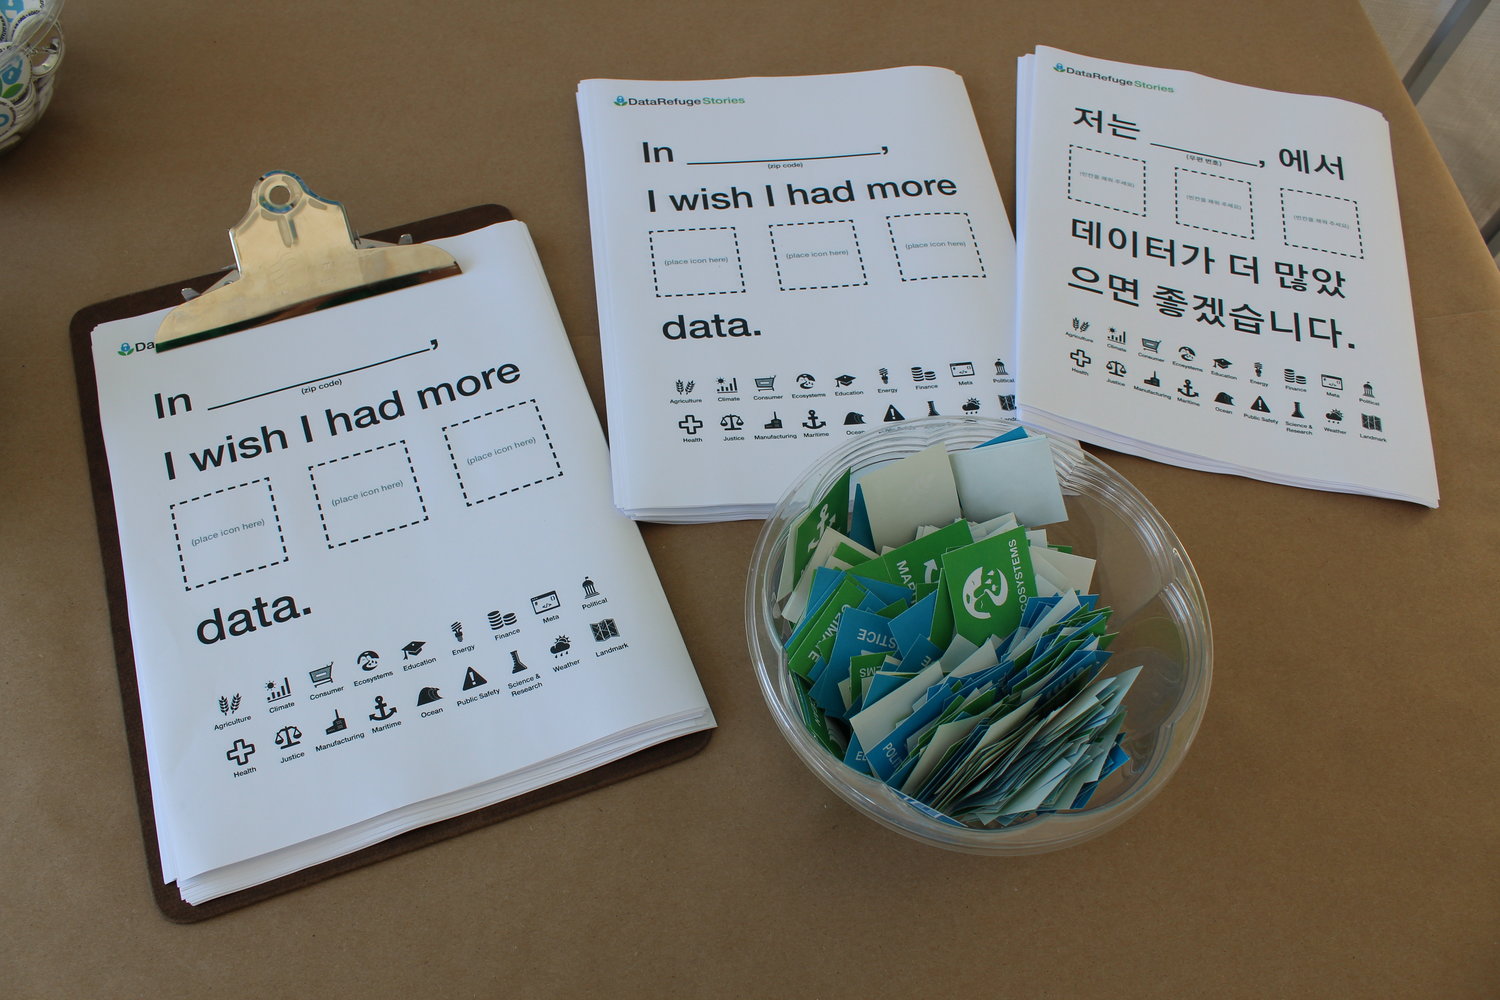
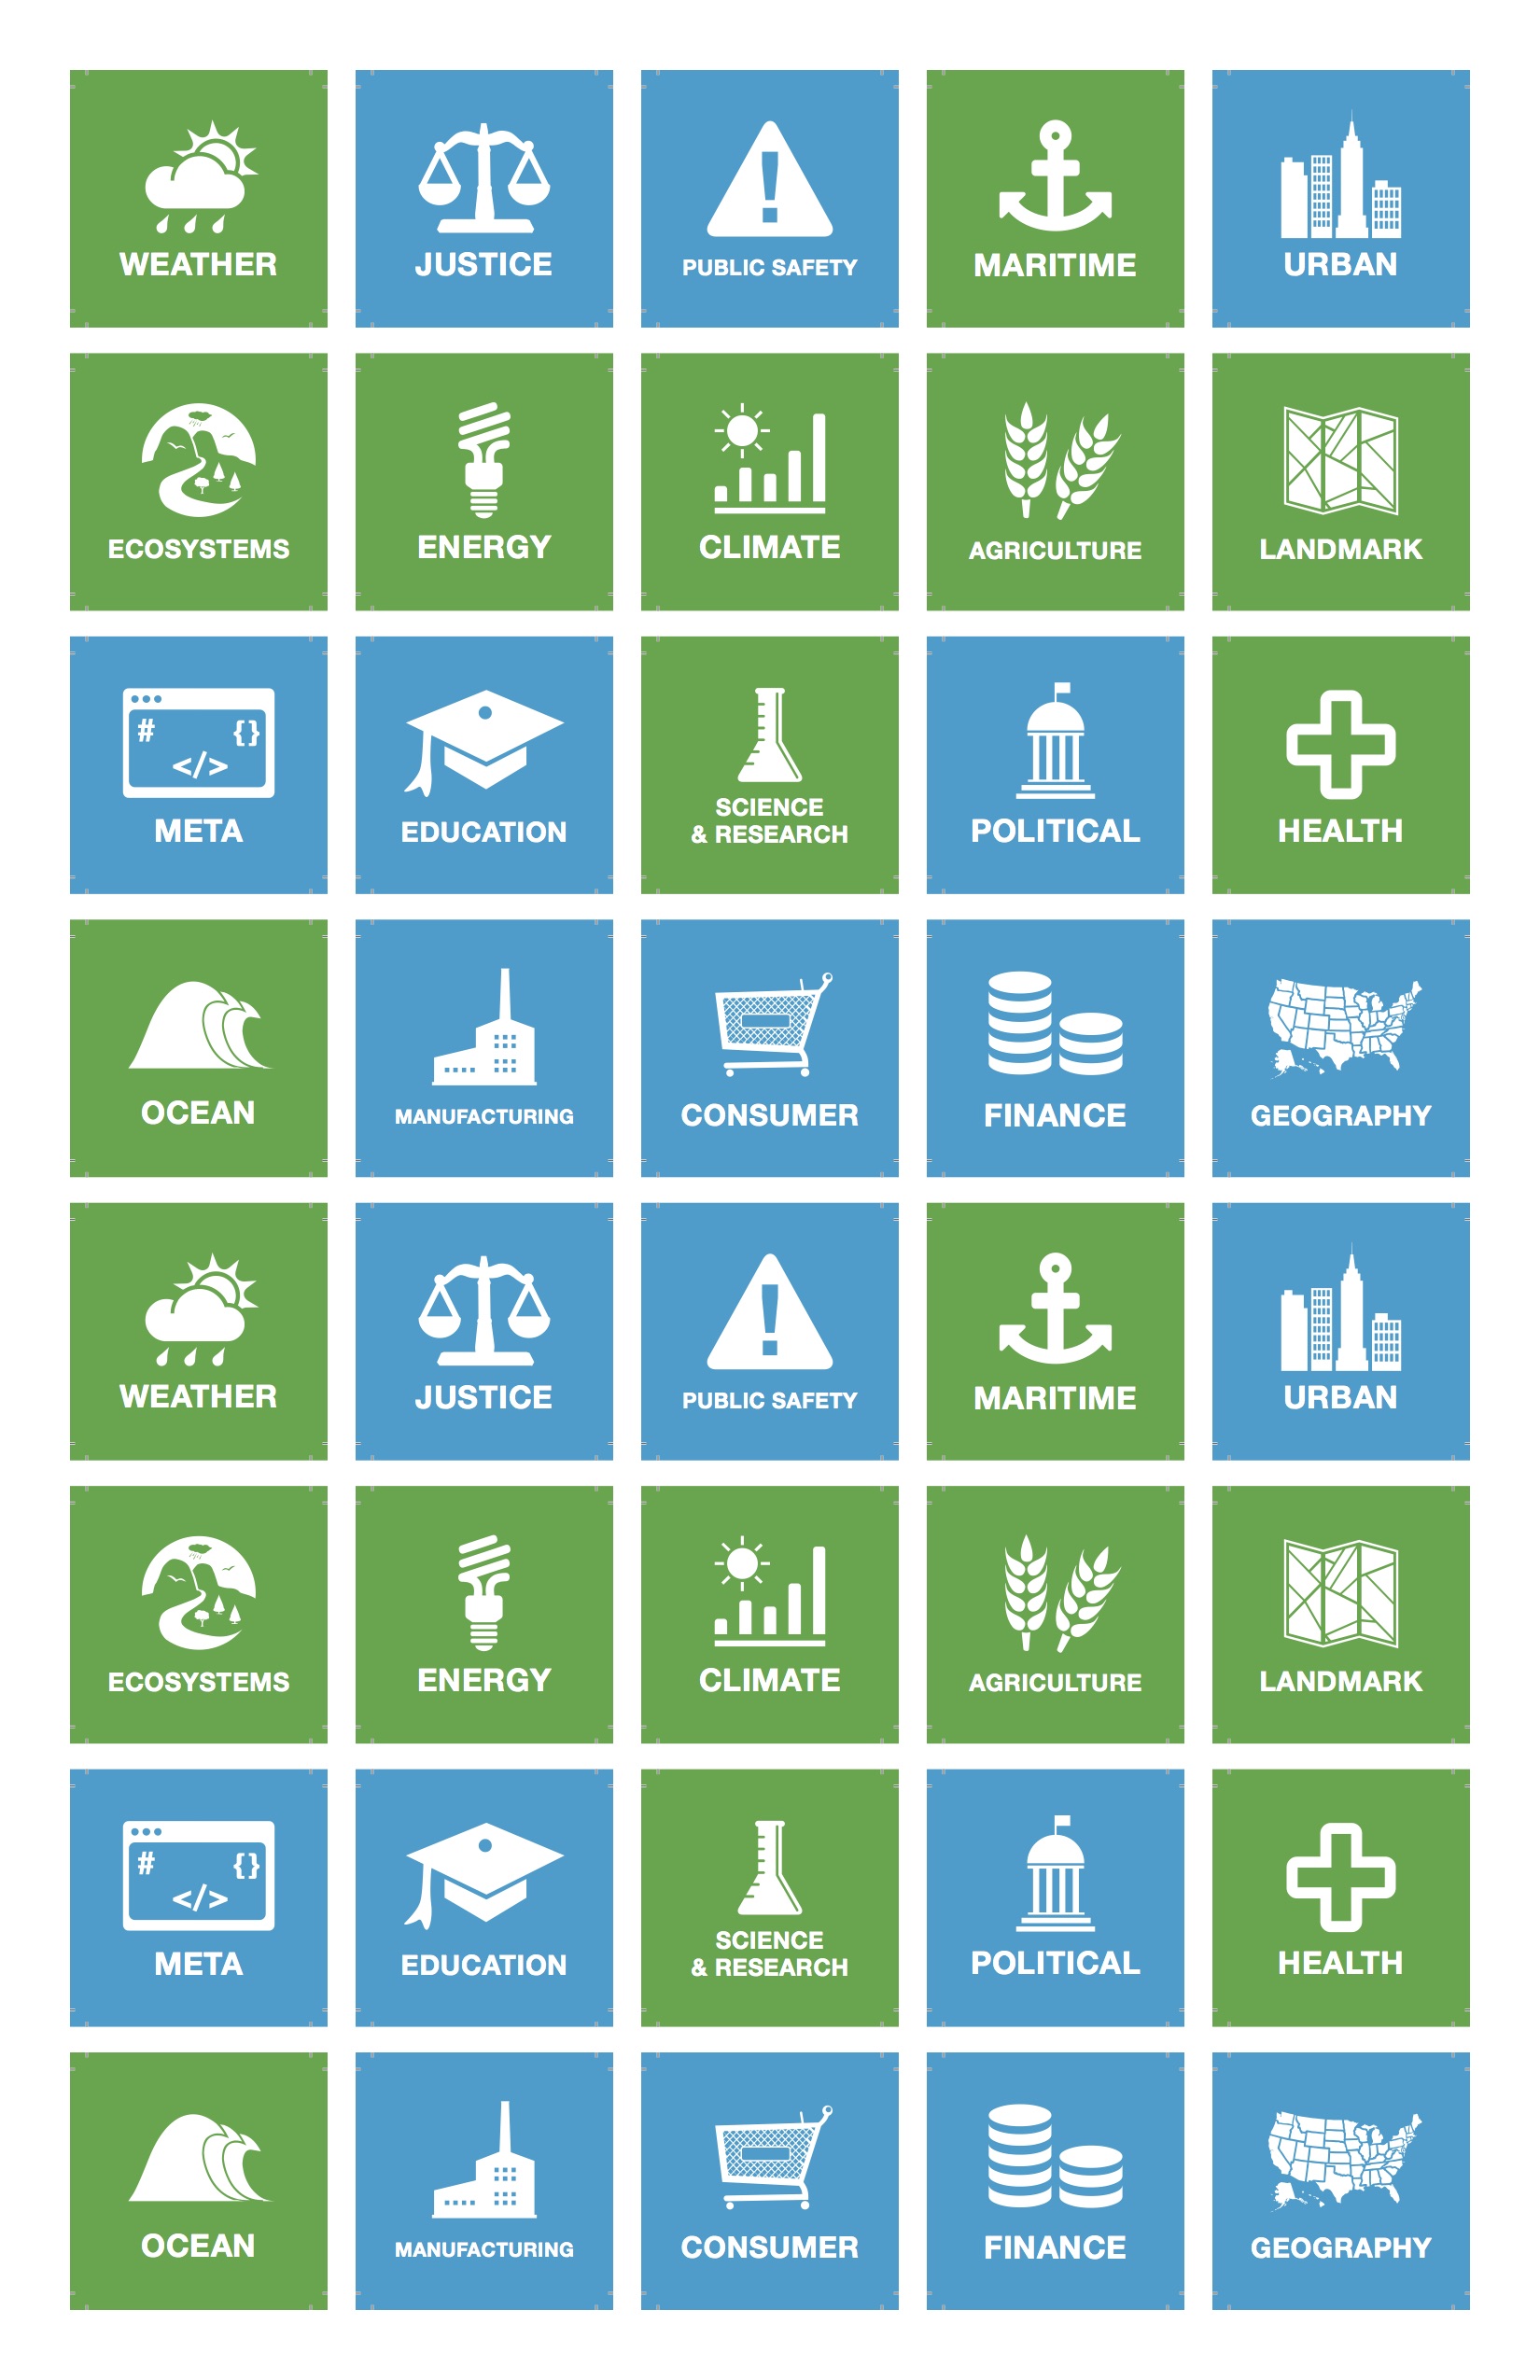
We also created simple forms that asked Philadelphia residents to think about and share the three kinds of data that they wished they had, based on the icons produced by Data.Gov. The results of these forms will be collection, organized, and shared with the City of Philadelphia's Office of Sustainability.

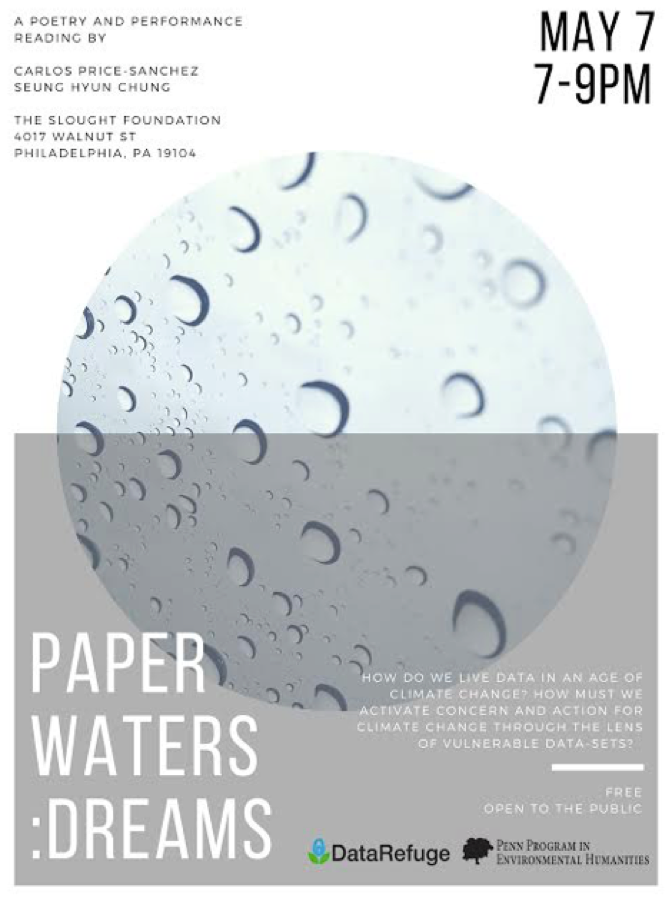
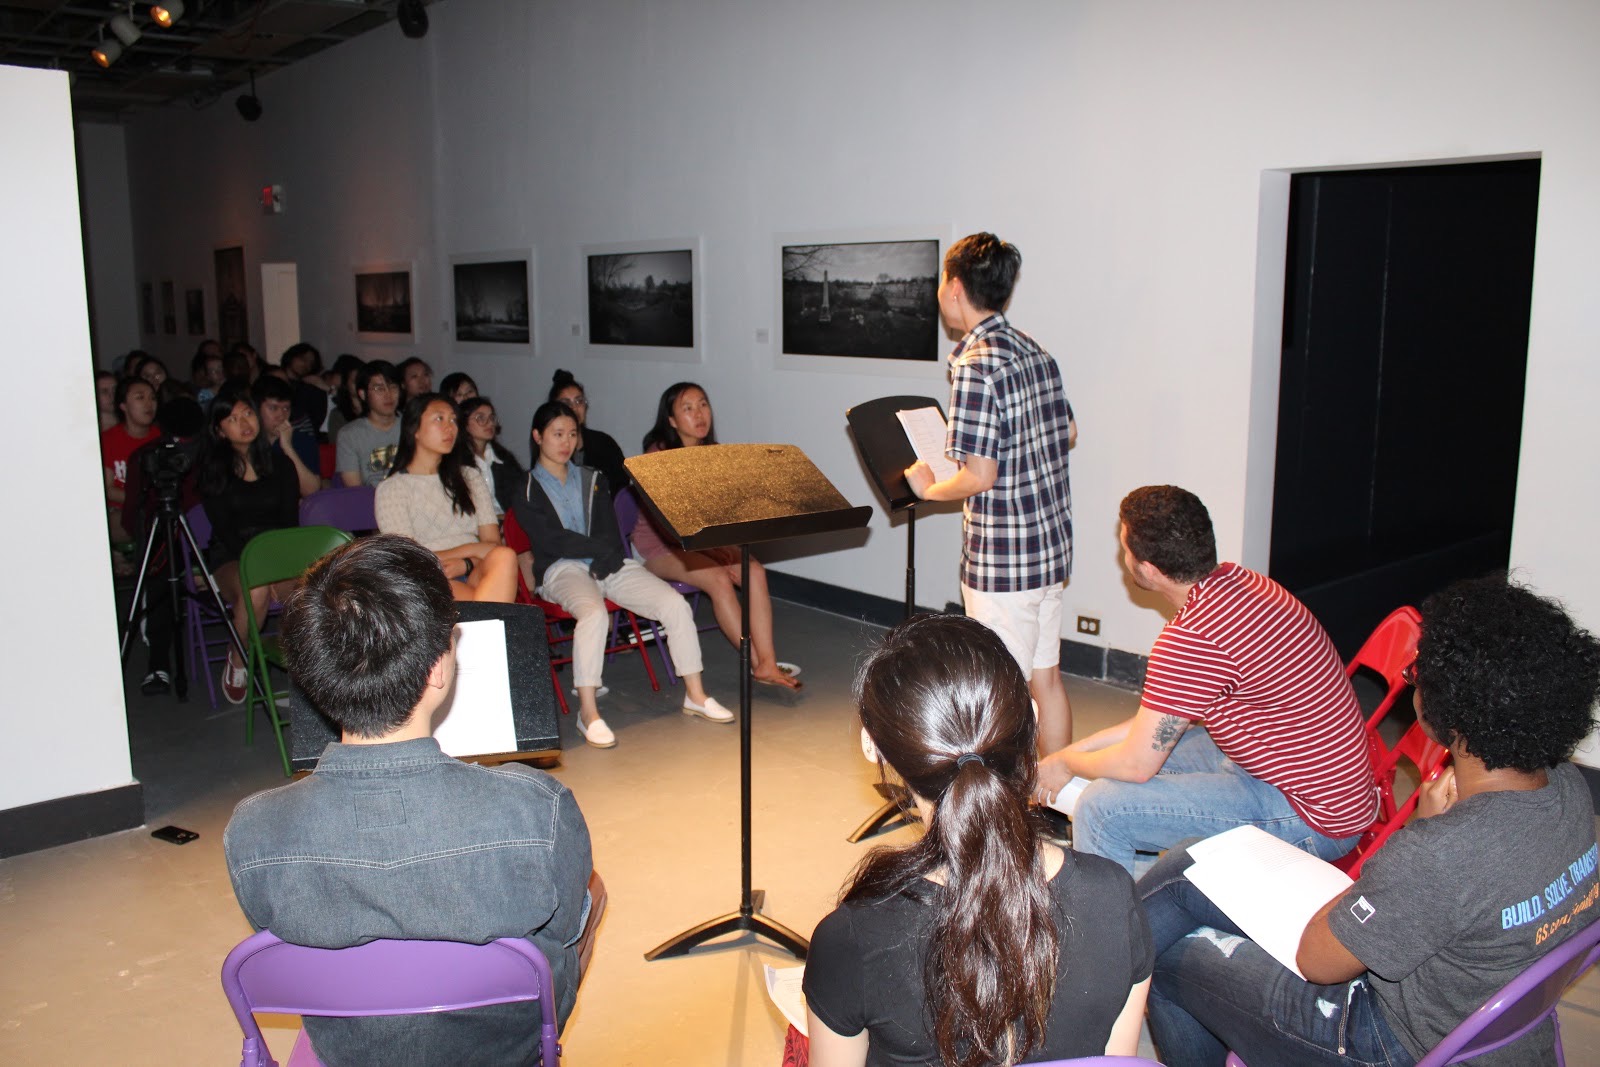
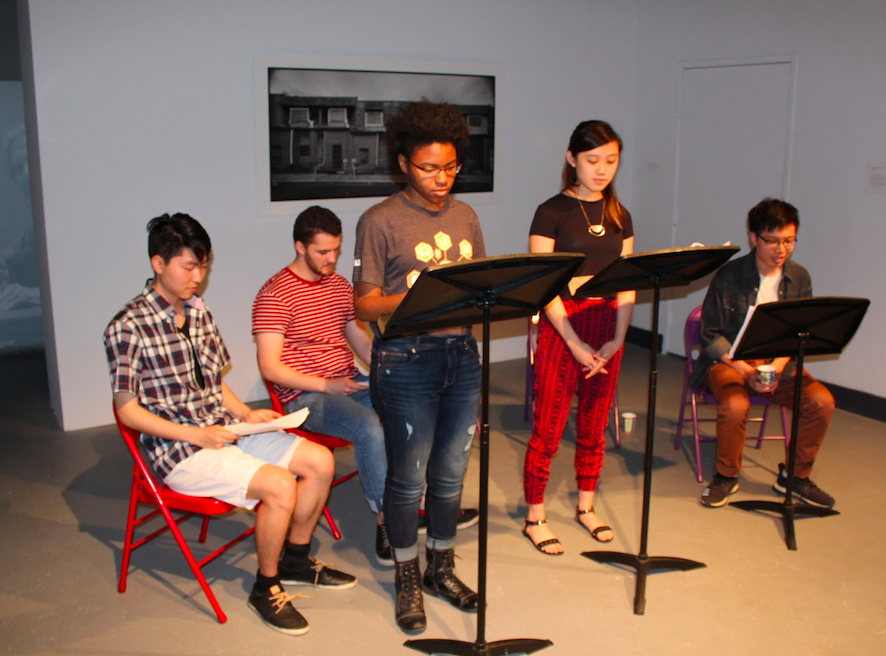
These tools have already sparked several other modes of storytelling, including more creative forms like poetry and playwriting. At Slought Foundation, two PPEH Fellows, Seunghyun Daniel Chung and Carlos Sanchez-Price debuted Paper Waters: Dreams, an evening of poetry and play-reading inspired by the Data Storybank.

The work of developing other modes of storytelling is not done. Although Phase One has come to an end, we are still developing Data Birth Announcements, Data Obituaries, as well as a four-part speaker series in collaboration with the Center for Media at Risk at the Annenberg School of Communication, and a ten-episode podcast to tie in with this series of essays that you'll find here at Data Remediations.
And: as we call for national partners to collaborate with us, we welcome you to adopt and adapt these tool and to develop new data storytelling tools for public engagements in your local towns, cities, and regions.